Image-Specific Class Saliency Visualization
给定一个图像和 CNN 的分类结果,图像中哪个像素对分类结果贡献大?
Simonyan et. al. 在文章 [1] 提出 saliency maps 解决这个问题。

给定图像 ,求 salency map
- 记把输入 在 ConvNet 的对应 c 类的输出分数为(其中 被一维化)
- 将在 处其一阶泰勒展开,得到等式
- 其中 是 在 的一阶导数,用 single backprop 方法求解
- 计算 saliency map
其中,用一阶导数表示 saliency map 的另外一种解释,是数值越大表明对结果影响越大,颜色越深。
另外,用 saliency map 的结果,可以辅助 GraphCut.
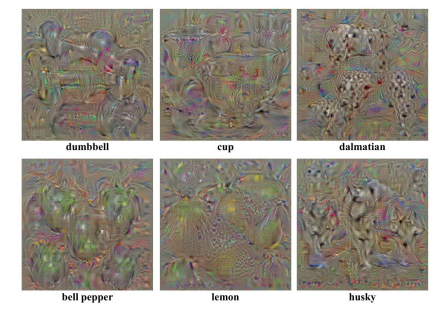
Class Model Visualisation
给定一个模型,如何将其可视化?Simonyan et. al. 在文章 [1] 提出 class representiative image generation 方法:
- 以 表示 ConvNet 对类别 C 的评分函数(softmax 的输入),设最优化目标
- 初始化
- 通过 backprop 梯度下降求解 ,得到每类的图像

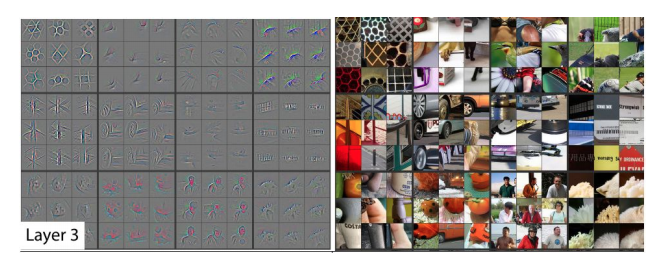
Deconv Reconstruction
[1] 的作者与 Deconv Reconstruction 方法 [2] 进行了对比,详见 [1] PPT

[1] Simonyan, Karen, Andrea Vedaldi, and Andrew Zisserman. “Deep inside convolutional networks: Visualising image classification models and saliency maps.” arXiv preprint arXiv:1312.6034 (2013). APA PDF PPT
[2] Zeiler, Matthew D., and Rob Fergus. “Visualizing and understanding convolutional networks.” European conference on computer vision. Springer, Cham, 2014. APA
